New in Version 16.0
Track Cookies Set by JavaScript
HttpWatch can now capture cookies that are assigned through JavaScript as well as cookies sent and received through HTTP headers. This makes it much easier to diagnose authentication problems, consent issues, tracking bugs and other client-side behaviour that would previously have been harder to trace.
A new JavaScript column in the Cookie tab can be used to view the source location where a cookie was set:
Improved Console Output and Analysis
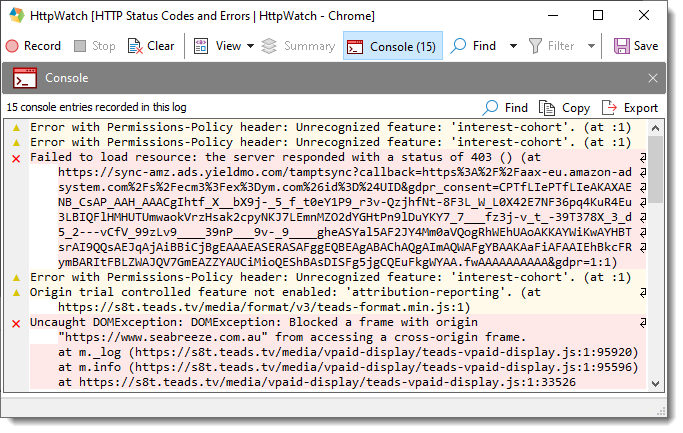
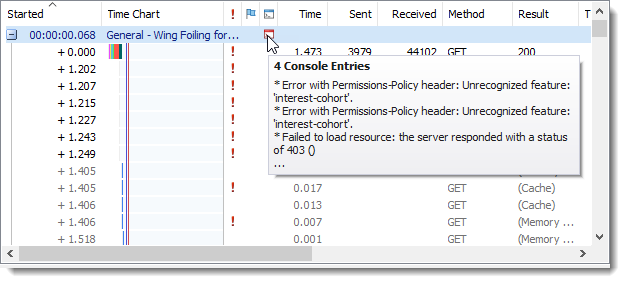
The Console window has been significantly enhanced to provide more useful debugging information. Console entries can now display additional metadata such as timestamps and stack traces in a foldable format:
Support has also been added for output generated by console.table, console.count, console.timeLog and console.timeEnd, with improved formatting of object values and other console data. Links in console output can be clicked to navigate directly to the related source code.
The View menu now includes options to expand or collapse all console entries and control whether new entries are expanded by default.
Warnings for Incorrect Content Types and Headers
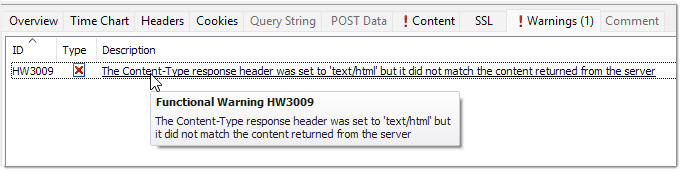
HttpWatch now detects cases where a server returns content with an incorrect content type or content header. New warnings, HW3009 and HW3010, highlight these problems and help identify server-side misconfigurations more quickly:
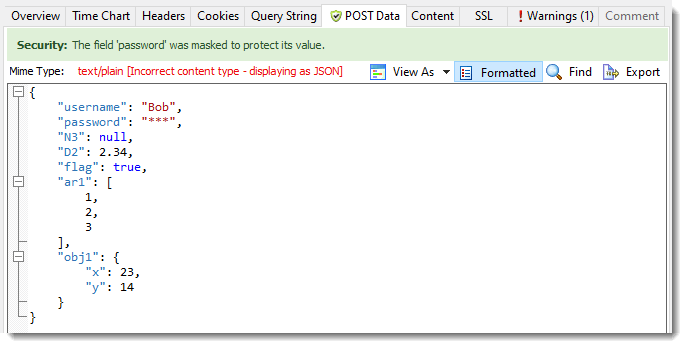
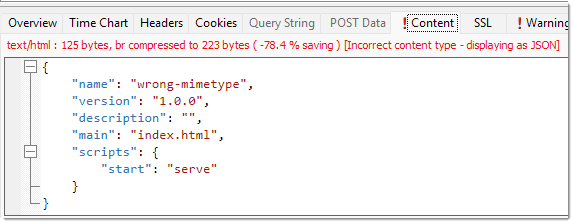
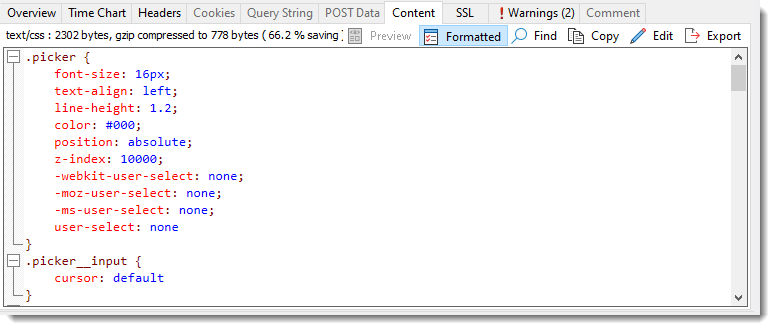
When common content types such as HTML, JavaScript, CSS, JSON or XML are detected with the wrong MIME type, HttpWatch will also apply the appropriate formatting and display a warning icon in the Content tab:
Better Integration with Chrome and Edge
Version 16 improves the way HttpWatch integrates with Chromium based browsers. When switching to a browser tab that is being recorded, the matching HttpWatch window is brought to the foreground. Likewise, activating the HttpWatch window will automatically switch to the corresponding browser tab.
The browser toolbar icon also now provides a clearer indication when recording is active:
![]()
More Accurate Timing and Request Handling
Request timing has been improved to provide more accurate start times and duration values, particularly in cases involving redirects and DevTools protocol timing differences.
These changes also improve the way redirected requests are handled so that the correct headers and timing information are displayed more reliably.
Browser and Operating System Information from HAR Files
When opening HAR files, HttpWatch can now extract browser and operating system information and display it as part of the session details. This provides more context when analysing traces captured outside HttpWatch.
Other Improvements in Version 16
Other enhancements in this release include a resizable Warnings dialog, improved title bar text showing the browser tab title and URL, faster handling of large request lists, and fixes for a number of issues affecting console search, SSL timing values and browser automation.
New in Version 15
Improved Display of Cookie Information
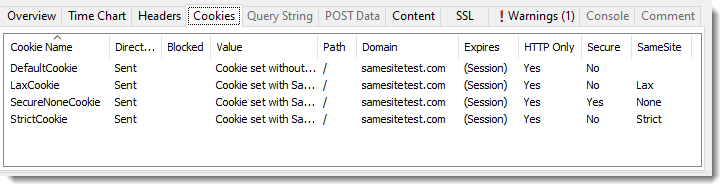
The Cookie tab now displays all attributes of sent cookies (e.g. Path, Domain, etc):
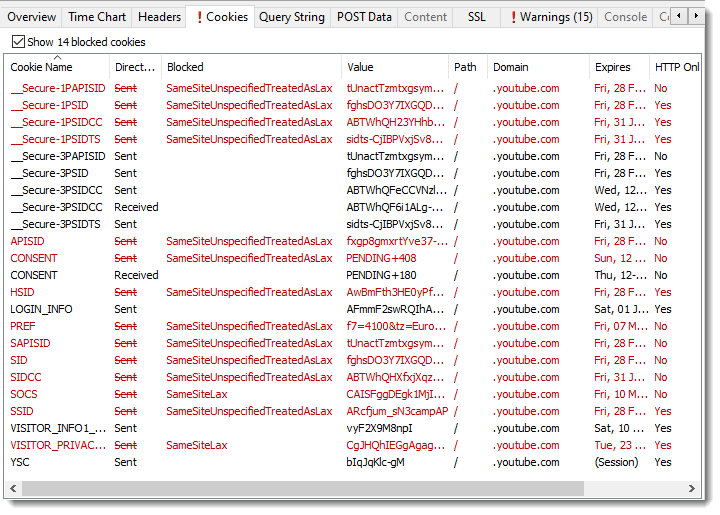
It also can optionally display cookies that were blocked by the browser along with the reason for blocking:
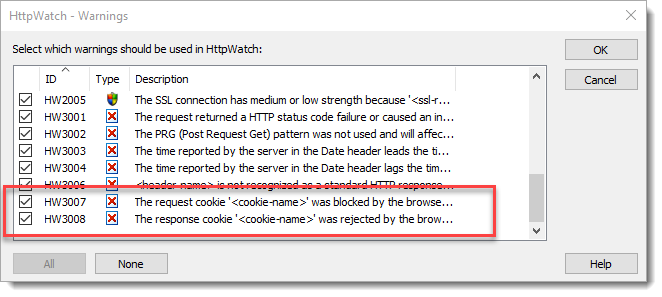
Two new warnings, HW3007 and HW3008 have been added to highlight cases where cookies were blocked:
Automatic Formatting of JavaScript, XML, CSS and HTML Content
HttpWatch can now automatically reformat most content types to make them more readable in cases where whitespaces have been removed or other minimizing techniques have been applied:
Supports Long File Names
HttpWatch now fully supports file names longer than 256 characters on Windows systems where this has been enabled.
New in Version 14
Console Output Recording
Console output from Edge and Chrome (version 64 onwards) is now recorded by HttpWatch. This includes logged error, warning and information messages and output from the JavaScript runtime such as syntax errors, exceptions and calls to the console.* API:
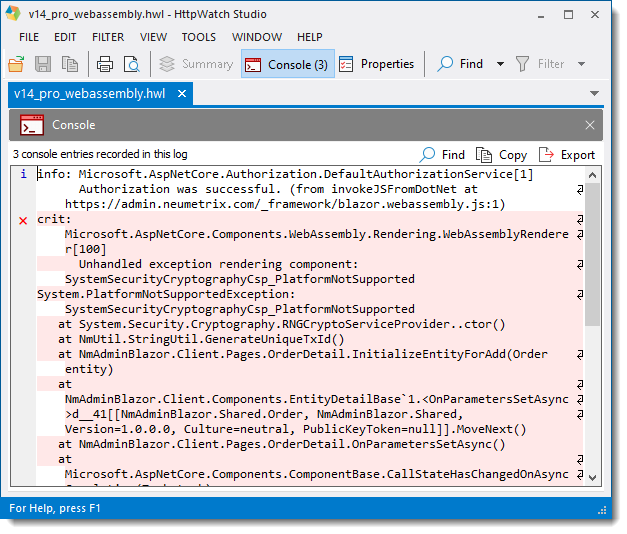
The console output from a browser can be essential for debugging client-side code in PWAs (Progressive Web Applications) that use large JavaScript libraries or WebAssembly hosted code (e.g. C#, C++ etc):
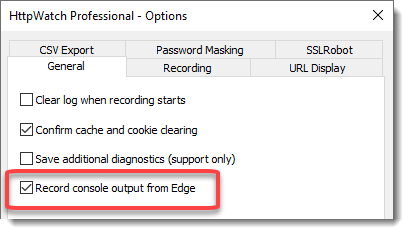
Console recording can be controlled from Tools->Options:
A new Console column shows whether console output was recorded for a page or request:
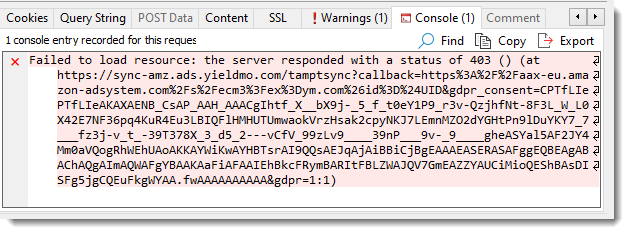
Console tabs show the console output associated with a selected page or request:
Updated User Interface
The HttpWatch UI has been updated with new flat look icons:
New in Version 13.1
Improved Display of URLs
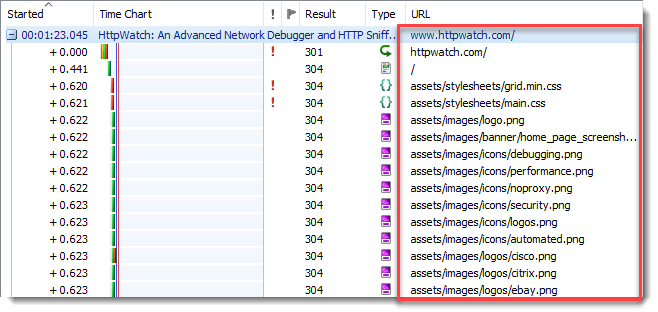
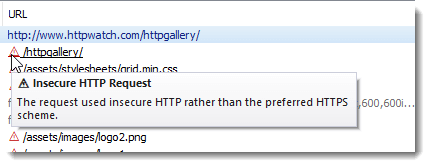
The page URL (including fragments) is now shown for each page group making it easier to debug Progressive Web Apps (PWAs) where URL fragments may be used for navigation. Also by default, URLs are displayed relative to the containing page and the HTTPS scheme prefix is hidden:
Insecure HTTP Warning Symbol
A red warning triangle is displayed next to insecure HTTP requests:
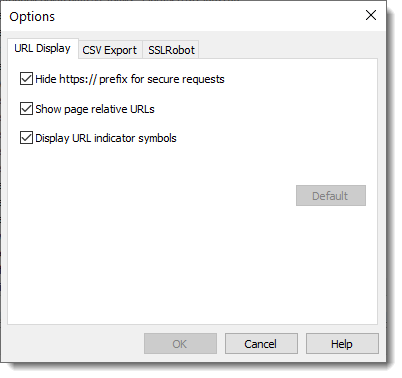
URL Display Options
A new URL Display options tab can be used to configure how URLs are displayed:
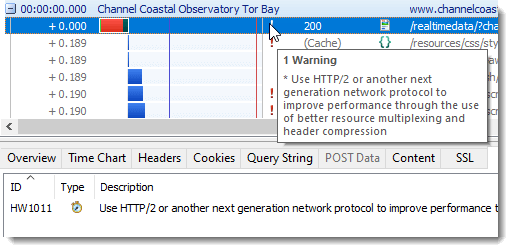
Warning Generated When HTTP/2 Not Used
A new warning (HW1011) highlights requests that did not use HTTP/2 (or a later network protocol) and therefore may not have optimal performance:
New in Version 13.0
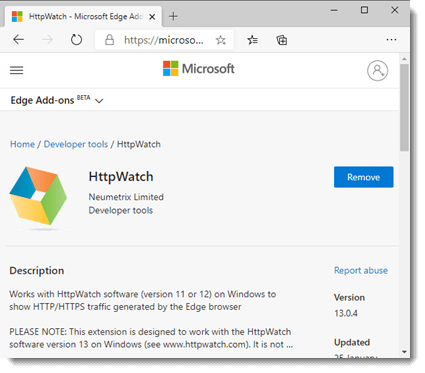
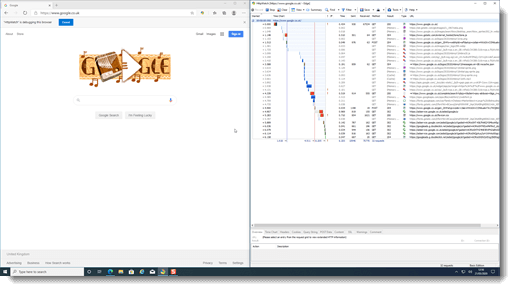
Support For Microsoft Edge
HttpWatch now supports Microsoft Edge version 80 or later using an extension hosted in the Microsoft Store:
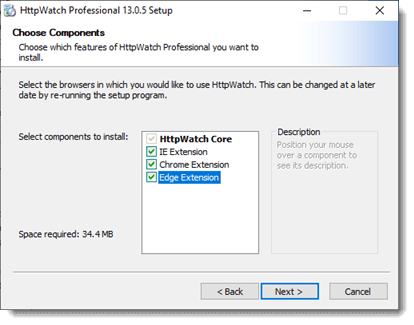
Enhanced Installer
You can now choose which browsers to use with HttpWatch when you run the installer. It is also possible to only install HttpWatch Studio if you just want to open existing HAR or HWL log files:
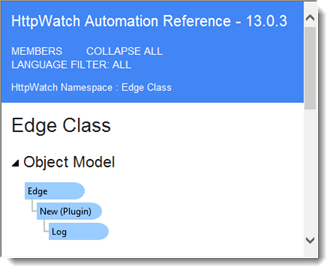
Automation Support For Microsoft Edge
Automation scripts can use the HttpWatch automation interface to control HttpWatch in Microsoft Edge:
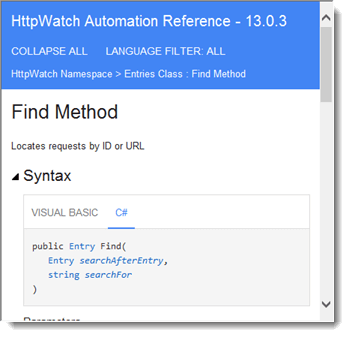
New Find Method on Entries Automation class
The Find Method can be used to quickly locate requests by URL or ID either within a page or a whole log file:
Supports Snapped Window Positions
HttpWatch now restores extension and log windows to their original position even if they were placed with the Windows snap feature:
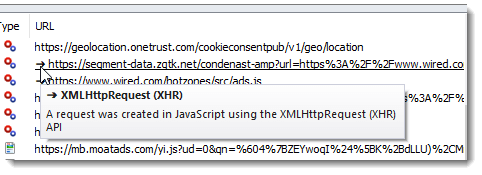
URL Indicator Symbols Show the use of Fetch and XmlHttpRequest APIs
In Chrome and Edge an arrow symbol next to a URL shows that a request was created using the XmlHttpRequest (XHR) API in Javascript:
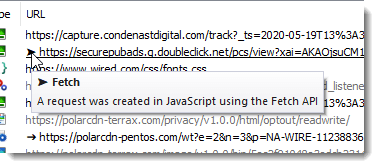
Or an arrow head symbol if the Fetch API was used:
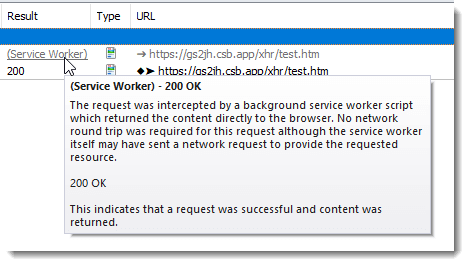
Displays Service Worker Activity
When a service worker script intercepts a request the Result now displays (Service Worker). The status code is available in the data tip or Overview Tab:
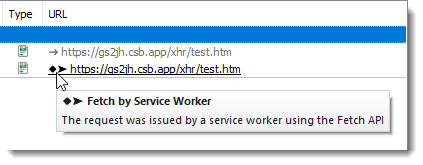
A diamond URL indicator is used to show the outgoing requests made by a service worker:
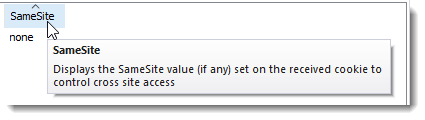
Displays SameSite Cookie Attribute
The cookie panel now displays the SameSite attribute for cookies received from the server:
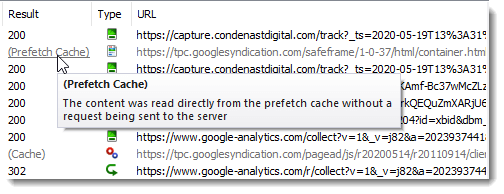
Shows The Use of the Memory and Prefetch Cache
The Result column in Chrome and Edge now shows whether the memory or prefetch cache was used:
Detects The Use of JSON Without The Correct Content Type
HttpWatch now formats and applies password masking to JSON content even if the content type has been incorrectly set to a different format: